Uncategorized

“On a Call” light notification for the new COVID-19 world

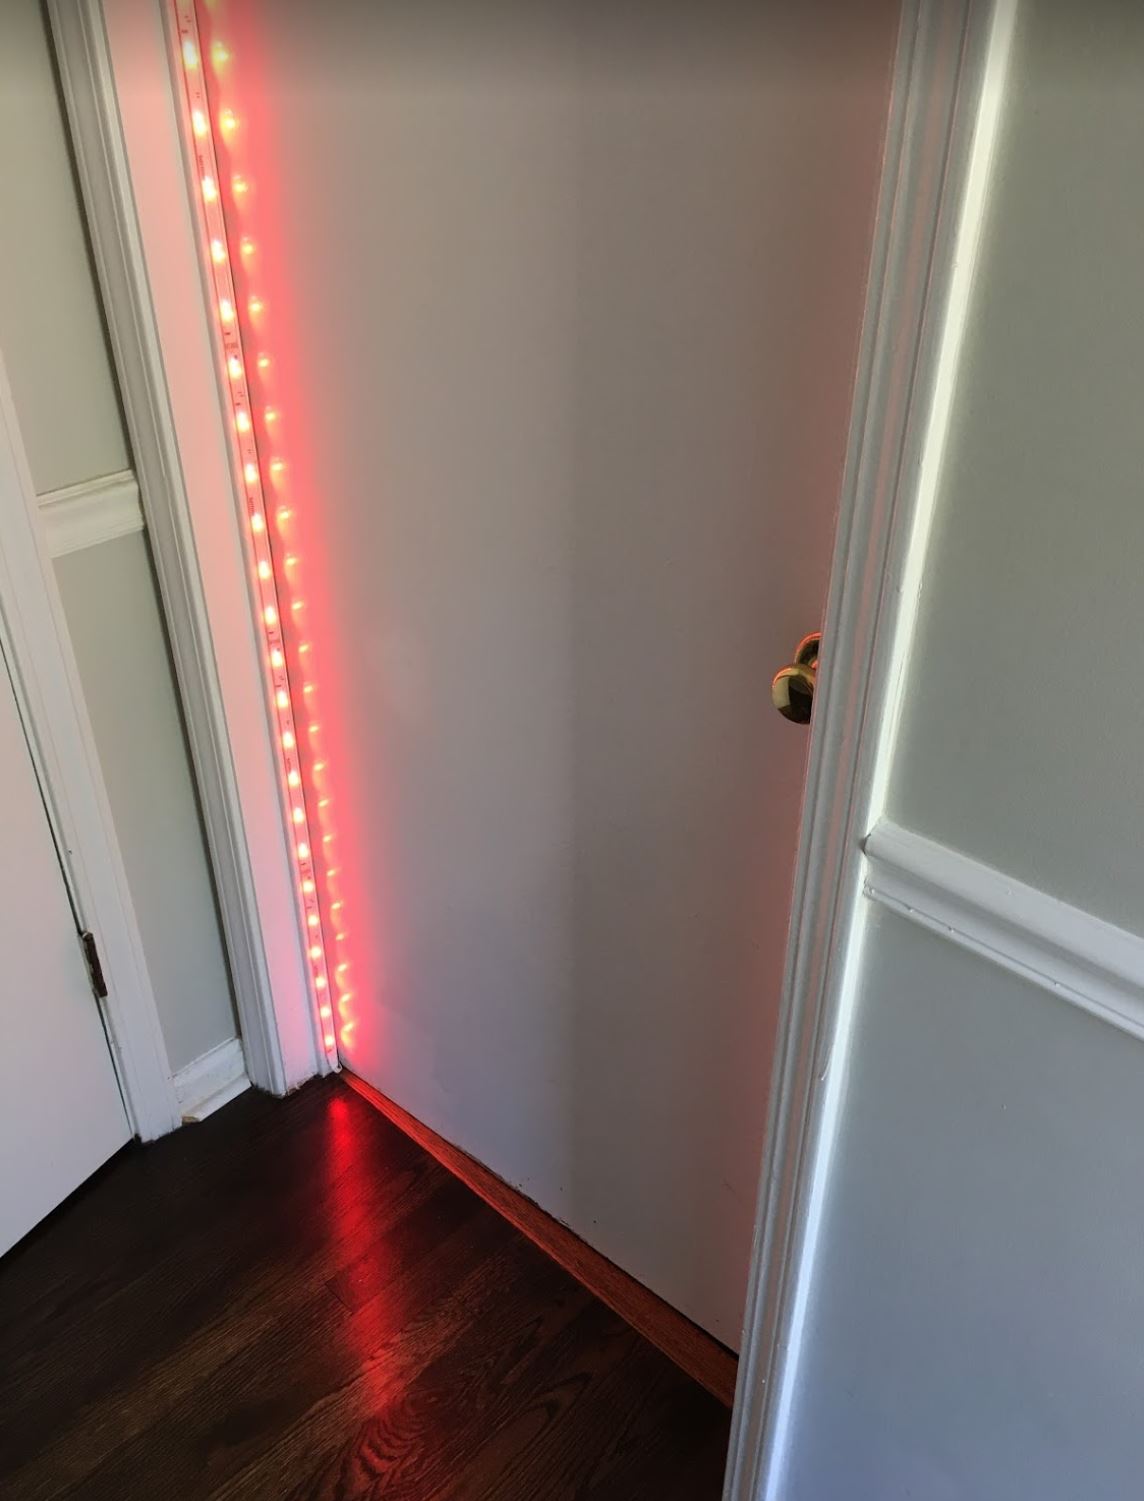
I am fortunate to have the opportunity to continue working from home during the pandemic. As myself and my family adapt to a new normal in a new working space at home, a way of notifying them when I’m on a call would prove useful.

So if you own a Plantronics (now Poly) headset, and have a Philips Hue Bridge with a light, I’ll explain how to build a little one-line script and have it light up when on a call. I love Plantronics (umm… Poly) stuff!!!

This works pretty much independent of the software you use to make calls or join meetings, because we’re pulling call state from the headset, not the apps. Teams, Zoom, WebEx, Jabber, Skype for Business, the script does not care. If the Hub Desktop supports it as communications platform (and they support quite a few) then it’ll work.

Here’s the summary of steps:

  1. Install the Hub Desktop software. This exposes a local API endpoint that you can query for when your headset is active.
  2. Create an authorized user on your Hue Bridge so you can send it commands via REST API.
  3. Find the Light ID of the bulb you’re trying to change state
  4. Set up a Scheduled Task to run PowerShell, query the Hub Desktop API and send commands to the Hue Bridge when call state changes.

Step 1: Pretty straightforward: go here and run the software. This will expose an API endpoint locally on port 32017 meant for third party app integrations. You can only access this via localhost/127.0.0.1, it does not listen on other interfaces. The endpoint we are interested in is http://localhost:32017/Spokes/CallServices/CallManagerState

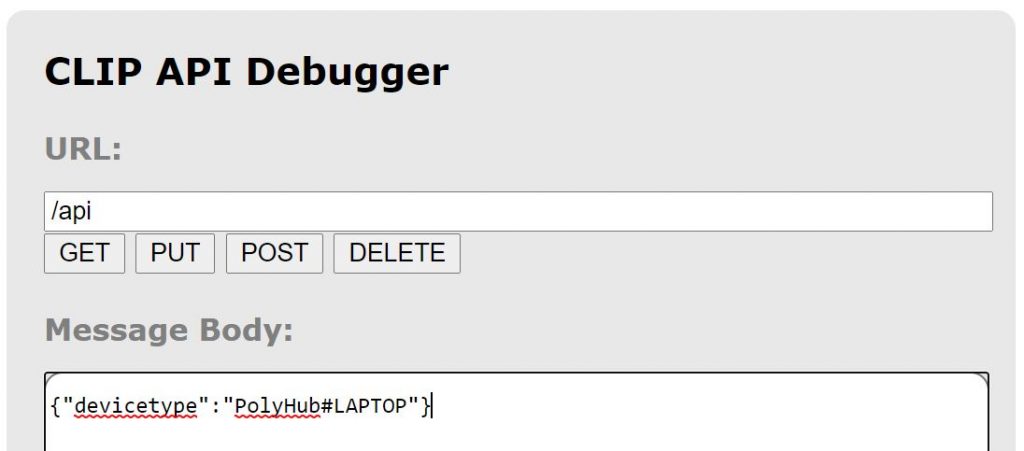
Step 2: Navigate to https://IPOFYOURHUB/debug/clip.html then use URL of /api, Body of {“devicetype”:”PolyHue#LAPTOP”} (change the json value to whatever you want, but the example will work), then go to your Hue Bridge, press the big button and press POST. You’ll get a username value back in the json response. COPY IT somewhere, as this is your key to sending authenticated API commands to the Hue Bridge.

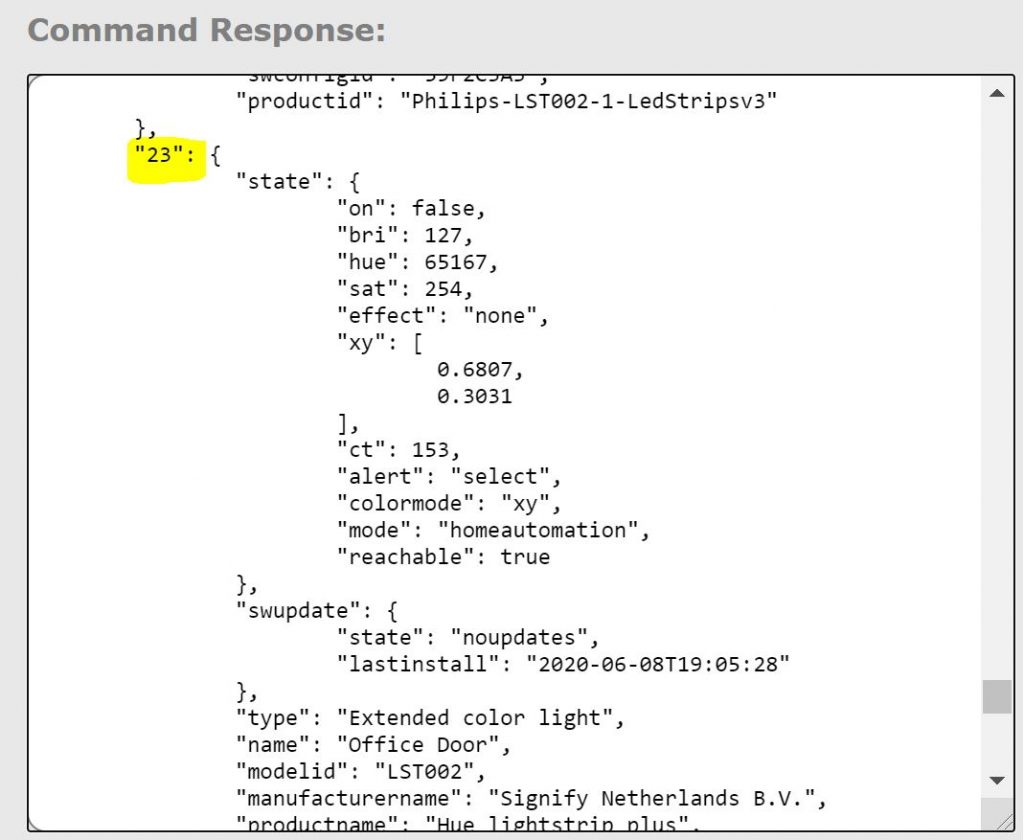
Step 3: Before you close the API Debug tool from your Hue Bridge, change the URL to /api/USERNAME/lights, using your new API username from Step 2, then press GET. Look at the json response and find the root number that matches the name of the light you’re using. They will be simple numbers, and in my case it’s “23”

Step 4: Set up a Scheduled Task to run At log on, and also set it to restart every 5 minutes for 999 times in case it quits because of a network disruption. Then have it run “powershell” with the following arguments pasted in and edited for your settings. Replace BRIDGEID, USERNAME and LIGHTID with your values.

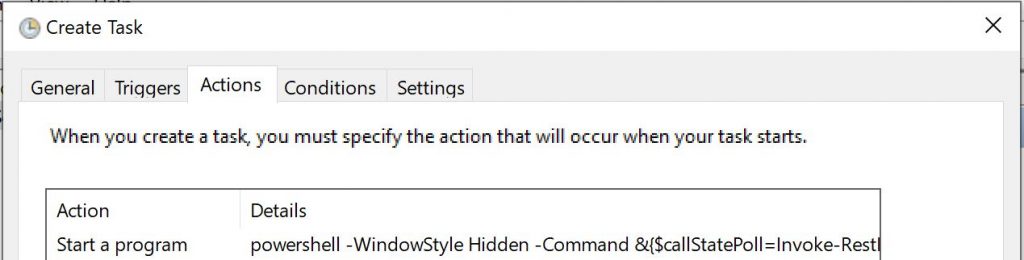
-WindowStyle Hidden -Command &{$callStatePoll=Invoke-RestMethod -Method GET -Uri http://localhost:32017/Spokes/CallServices/CallManagerState;while($true){$oldCallState = $callStatePoll.Result.HasActiveCall;$callStatePoll = Invoke-RestMethod -Method GET -Uri http://localhost:32017/Spokes/CallServices/CallManagerState;$newCallState = $callStatePoll.Result.HasActiveCall;If ($oldCallState -ne $newCallState){Switch ($newCallState){$false {$body = @{"on"=$false} | ConvertTo-Json;Invoke-RestMethod -Method PUT -Uri http://BRIDGEIP/api/USERNAME/lights/LIGHTID/state -Body $body};$true {$body = @{"on"=$true} | ConvertTo-Json;Invoke-RestMethod -Method PUT -Uri http://BRIDGEIP/api/USERNAME/lights/LIGHTID/state -Body $body}}};Start-Sleep -Seconds 5}}

Now to test it, turn on the light, set it to the desired brightness and color, then turn it off. The script will check every 5 seconds your call state, and if it changes, it will flip the light on if you have an active call, and off if you don’t.

The main gotcha: This will only work when using a Plantronics/Poly headset, as we rely on the API from Hub Desktop to give us call state. Jabra Direct software may work but couldn’t get the right API endpoints to query call state.

Hope it helps someone out there, and stay safe!

Tesla, Smart Meters and Automation via APIs

A couple of months ago I took delivery on my Tesla Model 3 “Speedy”. In the time between placing the order and actually getting the car, aside from being beyond excited, I took a bit of time to learn about the car’s always-connected API and how to use it, and also signed up for off-peak billing from my local utility ComEd.

Then I decided to take things to a new level by combining two API’s and making some triggers for charging, so this is the whole point of my post.

Early TL;DR: Using ComEd’s Hourly Pricing’s API, Tesla’s API, HomeSeer’s software and a couple of plugins, I am now triggering charges when electricity prices are super low, so I can charge the car for a couple pennies per kWh or even for free or get money back.

Initially I wanted to see if there was a way to tie the car to my home automation software, HomeSeer, and turns out there’s an awesome plugin called teslaSeer. It uses Tesla’s API to create objects within HomeSeer’s interface, so now you can schedule actions or create triggers, like have the car to heat up based on a time or what’s on my calendar for the day. One of the options is to start or stop charging.

teslaSeer plugin on HomeSeer

Right after putting in the order for the Model 3, I signed up for ComEd’s Hourly Pricing program which takes about a month to really kick in. My thought was just to use the off-peak pricing and schedule my charges from the Tesla directly, say at 2am every night. But… turns out ComEd’s Hourly Pricing program ALSO has an API, just like the car, which is AWESOME and far better than just simple off-peak. The API gives you an output of either JSON or XML with 5-minute average or hourly average.

What’s even more interesting is that anyone can see the “Dashboard” off ComEd’s program, and sometimes it dips BELOW 0c, meaning you’re getting credited for consuming electricity as an hourly customer.

So I thought… if there’s a chance that price could dip below say… a penny per kWh… could I automate a charge then? And stop it if the price is too high?

OF COURSE, it just took some sweat and hacks. My way of doing this isn’t particularly elegant or friendly, but it works for me. Think of IFTTT but with a lot more duct-tape to make it all work. (sidenote, ComEd Hourly Pricing has an IFTTT trigger or whatever it’s called, but it’s not quick enough for what I need”

Here’s what I ended up doing…

  1. Using Jon00’s DataScraper script, created a trigger on price dips and jumps from ComEd every minute. Basically “If price is below 1”
  2. With teslaSeer, wake then update the car to get it ready to take in the next couple of commands. The event won’t continue until the car is awake which takes anywhere between 30 seconds and 2 minutes
  3. Once the Tesla is awake, set SoC to 90% (I usually leave this set to 70%) and then trigger a charge. That gives me at least 16kWh of juice I can consume, more if the car has been discharged
  4. If the event gets triggered, send me a notification

My electric bill was actually lower in price by about 15% with this going, but was about 30% higher in kWh consumed. Go figure :). My Tesla seems to be running on free electricity.

That’s about it. There’s another event that stops the charge if the price goes above a certain value and also the battery is over 70% SoC. That way I don’t wake up to a car that didn’t charge because it was stopped because of some price fluctuation. Below is what the whole thing looks like right now. Again, not pretty, but completely functional and reliable.

HomeSeer’s “Events” page on the Tesla group

To the smart folks out there I’m sure there’s a better way to trigger these things to happen, maybe using AWS Lambda or Azure Functions instead of HomeSeer, after all it’s just HTTP calls that we’re making and some basic parameters passed. If you have something similar working, I would absolutely love to hear it.

Also, If what I just wrote pushed you over the edge to get a Tesla and want to get 6 months of free Supercharging with it, here’s my referral code: 
https://ts.la/gonzalo13311

LS Data MCU events 41025 and 41026 starting in May-June?

If running Lync Server 2010, Lync Server 2013 or Skype for Business Server 2015, and started noticing these in your Lync Server event log sometime between May and June of 2017, while at the same time people can’t share PowerPoints or do Whiteboards / Q&A…

Then you’ve fallen victim of a known issue with the May 2017 .NET Framework Security and Quality Rollup affecting the Web Conferencing Service.

Luckily, Microsoft detailed two workarounds, one involves getting a new Edge Internal cert, and another involved a registry change. Here’s the details:

https://support.microsoft.com/en-us/help/4023993/ls-data-mcu-events-41025-and-41026-are-constantly-generated-after-you-

Skype Front End not starting on dual-homed VM

TL;DR: When dual-homing, make sure both your NICs have the same link speed (1Gb, 10Gb). VMware’s E1000E is 1Gb, and VMXNET3 is 10Gb. Automatic metrics will prefer the 10Gb and that may cause the issue below….

After a power loss over the weekend, two Skype for Business Front-Ends were restarted and the RTCSRV service failed to start. A bit about these machines that’s relevant to the issue:

  • Running Widnows Server 2012 R2 as VMware ESXi 5.5 guests.
  • Collocated Mediation service.
  • Dual-homed, with Data network as default gateway, and Voice network to talk to a Sonus SBC, with service usage limited to the specified addresses for Primary and PSTN in the topology.

Certificate stores were in good order, so KB2795828 did not apply.

Event ID’s seen in the log were LS User Services 32178:

Failed to sync data for Routing group {0FCDD1FD-39AF-502A-AECA-E702A5E8FC55} from backup store.
Cause: This may indicate a problem with connectivity to backup database or some unknown product issue.
Resolution:
Ensure that connectivity to backup database is proper. If the error persists, please contact product support with server traces.

LS User Services 30988:

Sending HTTP request failed. Server functionality will be affected if messages are failing consistently.

Sending the message to https://FE1.domain.org:444/LiveServer/Replication failed. IP Address is IPOFVOICENIC. Error code is 0x2EFD. Content-Type is application/replication+xml. Http Error Code is 0x0.
Cause: Network connectivity issues or an incorrectly configured certificate on the destination server. Check the eventlog description for more information.
Resolution:
Check the destination server to see that it is listening on the same URI and it has certificate configured for MTLS. Other reasons might be network connectivity issues between the two servers.

and User Services 32174:

Server startup is being delayed because fabric pool manager has not finished initial placement of users.

Currently waiting for routing group: {EF5151C7-B5E1-53B8-9F61-0CC90C82B9F6}.
Number of groups potentially not yet placed: 9.
Total number of groups: 9.

[…]

The issue ended up being different Adapter Type in VMware for both NICs. The primary NIC was set to E1000E, so 1Gb/s Max, and the Voice NIC, which was added after the server was deployed, was set to VMXNET 3, which runs at 10Gb/s regardless of uplink bandwidth from the host.

Turns out the Windows Automatic Metric was messing up interface preference here because it was setting the 10Gb/s NIC with an automatic lower metric.

Manually setting a lower metric for the Primary NIC and rebooting the server resolved the issue.

Skype for Business Server June 2016 CU

New features!

  • Video Based Screen Sharing (VBSS) in meetings, enables much more efficient screen sharing with fluid motion (not the 2fps we’re used to in meetings.
  • Multiple Emergency Numbers in a location policy, useful for universities that may have their own local emergency number in addition to 911
  • Busy Options like Busy on Busy and Voicemail on Busy.

Get it here:

https://support.microsoft.com/en-us/kb/3061064

T.38 Fax over IP call on Wireshark

Ever wondered what a proper T.38 Fax over IP (FoIP) transmission looks like running through Wireshark? Maybe you’re troubleshooting a call flow, or never seen a T.38 capture. Below I’ll try to explain the call flow and steps to look out for when troubleshooting T.38 calls. Here’s an Outbound FAX call originating from a FXS port in a Cisco CUBE, and going towards Flowroute.

  • Initial SIP INVITE and early media receipt (ringback). Note this is all RTP.
    2016-03-22 16_08_08
  • SDP from the INVITE shows media offered is all voice (RTP)
    2016-03-22 16_10_50
  • 183 Session in Progress, and we start sending media too (again, RTP). Later on comes the 200 OK, meaning the call was answered on the remote end.
    2016-03-22 16_09_50
  • Things changing now… in-dialog (RE)INVITE from Cisco CUBE to SIP trunk… RTP and T.38 packets mixed because the remote end has not accepted our INVITE yet, but we start sending media either way.
    2016-03-22 16_14_17
  • And the SDP of the new INVITE now shows all T.38 media now.
    2016-03-22 16_14_59
  • Once we get the 200 OK from Flowroute, it’s all T.38 media both ways.
    2016-03-22 16_15_44
  • Now the flow gets interesting, more Fax-ey. Wireshark will decode the HDLC data and show interesting bits here
    • TSI, is our Fax station number programmed in the machine.
      2016-03-22 16_17_35
    • DCS, our Fax machine communicates the capabilities, and starts training.
      2016-03-22 16_18_34
    • If we look inside the packet’s data, our DCS has a lot more information about our Fax machine’s settings and resolution
      2016-03-22 16_44_22
    • Then we get an FTT, means the remote end “Failed to Train”. Not usually a sign something is wrong, but more a capability mismatch. The remote fax may accept only lower baud rates, and will fail to train any higher. This is normal unless it’s the only response we get back from the remote end.
      2016-03-22 16_18_49
    • We see the same process of TSI, DCS and FTT until we hit the right baud rate… in our case it’s 9600… Once we get that, we receive a CFR.
      2016-03-22 16_20_19
    • Followed by a short training to sync-up and data (because we did long training before the CFR)
      2016-03-22 16_20_35
    • And our actual FAX data which will vary
      2016-03-22 16_21_21
    • At the end of the data, Wireshark reassembles the packets and tells us whether there was a loss or not. In our case, we’re good!
      2016-03-22 16_21_50
    • We send an EOP to signal the end of the transmission
      2016-03-22 16_22_21
    • The remote end does an MCF to acknowledge receipt (this is how your Fax machine knows the fax is “good” on the other end)
      2016-03-22 16_22_40
    • And then we send a DCN to logically hang up the HDLC stream, but we wait for the remote end…
      2016-03-22 16_24_42
    • Remote end hangs up the call… and we’re done…
      2016-03-22 16_25_02

And that was it. Many exchanges and training but in the end our page was sent over a SIP trunk, negotiating T.38, training with the remote fax machine at 9600 baud, and transmitting one page in about a minute.

Remote Wireshark capture for Sophos UTM over SSH

Sophos UTM v9 comes with the tcpdump utility, which lets you run packet captures from the shell. This is great and all, but in order to look at those pcaps with Wireshark, you need to pipe to a file, copy the file, then run Wireshark against it. Annoying. All of it.

What if we could remotely capture packets over an SSH tunnel? YES… turns out it’s a bit tricky if you’re on Windows, and the authentication piece to get root access without having to do the loginuser first. How? Keep reading…

First, the necessary ingredients:

  • Sophos UTM
  • Wireshark (or your favorite pcap application)
  • Putty suite (specifically Plink and PuttyGen)

To start, we’ll need to enable Shell Access, with public key authentication, and with Root access but only with SSH key.

2016-03-16 15_10_50

We need to use PuttyGen to generate the key pair we’ll use for root authentication, so open it, Generate the key, then copy the Public Key into the Authorized Keys for root in the UTM, apply and save… and also Save private key to somewhere you’ll remember. We’ll need this for Plink.

2016-03-16 15_10_08

There’s our new key…

2016-03-16 15_13_30

Then run the actual magic using Plink. Take the following command as an example:

plink -ssh root@firewall.domain.com -i C:\ssh-priv.ppk “tcpdump -s 0 -U -n -w – not port 22 and not host 192.168.0.1” | “C:\Program Files\Wireshark\Wireshark.exe” -k -i –

Replace the SSH connection string for your actual firewall FQDN, the filename of ssh-priv.ppk for the location of your saved Private Key generated with PuttyGen, and the not host 192.168.0.1 with the IP address of the firewall from the interface you’re reaching it.

Wireshark will open and start showing packets. You can smile and jump now.

You can modify the tcpdump parameters to better match the capture, for example, using -i eth1 to capture a specific interface, or filter specific traffic… once you’re done, just close Wireshark and CTRL+C the command.

Note, if you’re doing this capture remotely over WAN or Internet, it will tunnel ALL packets over SSH, so it will take up a lot of bandwidth…

Have fun!!!

VMware Power Policy and CPU Ready latency

VMware’s Performance Best Practices mentions you should set power management in the BIOS to “OS Controlled Mode” or equivalent. This is so you can control power saving from the hypervisor itself. It’s very useful when you want to change these settings on the fly without having to reboot into the BIOS, similar to how Windows power profiles work.

But the “gotcha” here, which is also mentioned in the best practices documentation, is that the default Power Policy setting is set to Balanced, when you most likely want to set this to High Performance, as you’ll see later…

2016-03-01 10_39_33

This makes it pretty awful for latency-sensitive workloads. In Balanced, your CPU sometimes has to scale up or down in the power states before it can process an instruction, and this adds latency. The difference can be clearly seen by looking at the CPU Ready (RDY%) metric. Here’s the difference changing to High Performance made in a single vCPU VM:

2016-03-01 10_32_13

And here is a 4 vCPU VM running Exchange 2013

2016-03-01 10_32_34

My VM’s felt “snappier” after the change. It’s hard to avoid speaking subjectively here, but click-to-action felt quicker. Maybe it’s in my head, but I feel those charts tell a different story.

The effect the “Balanced” power savings has on CPU Ready times is clear as day, though it’s mentioned that Balanced has minimal to no impact on performance. I have yet to do benchmarks to show how CPU Ready% affects real workloads, but at the very least, CPU instruction latency from a guest VM is dramatically decreased, which benefits those real-time workloads like Lync, Skype for Business or VoIP.

VMware NSX Lab in a night = awesome

So… VMware’s NSX is super awesome! I’m one of those weird guys that find playing with networking and virtualization on a Monday night more fun and exciting than a weekend in Vegas. Ok, maybe not so much, but still somehow I managed to stay up past midnight deploying an NSX “Lab” just by messing with it. I say screw the guide, I learn better by just pressing buttons and breaking things… I’m not doing this for a client so what gives? Let’s poke…

After some fun I’ve gone from just knowing concepts of SDN to a fully usable network running on top of VMware NSX. It’s complete with:

  • Single 6.2 controller
  • VXLAN transport on a Force10 S60 with PIM and IGMP snooping enabled
    • Since I already had Distributed vSwitches, it was very easy to provision the transport
  • Multicast Transport Zone and segment ID
  • Single NSX Edge running OSPF connecting to the S60 core and redistributing connected networks
  • Single logical switch (for now)
  • Two VM’s on two different hosts to test connectivity
  • Smiles

Captured live flows while downloading a CentOS ISO from a mirror site just to test speeds.

Screen Shot 2016-02-23 at 12.35.01 AM

So far i’m very impressed with what NSX can do, and i’ve only scratched the surface. Think stretched networks over L3, per-VM firewall policies both at Layer 3 and Layer 2 levels, Logical routers between virtual switches, each with its own ACLs, HA edges, so many cool things!. Only 59 days left…

It’s almost 1am and I should really go to sleep now. Good night.

New Technical Diagrams for Skype for Business Server 2015

Released last week, new technical diagrams in Visio and PDF for Skype for Business workloads, Call Quality Methodology (CQM) and different hybrid scenarios.

https://technet.microsoft.com/en-us/library/dn594589.aspx

SfB Protocol Workloads poster

Thumbnail for the CQM poster

Plan Voice Solution poster Thumbnail